


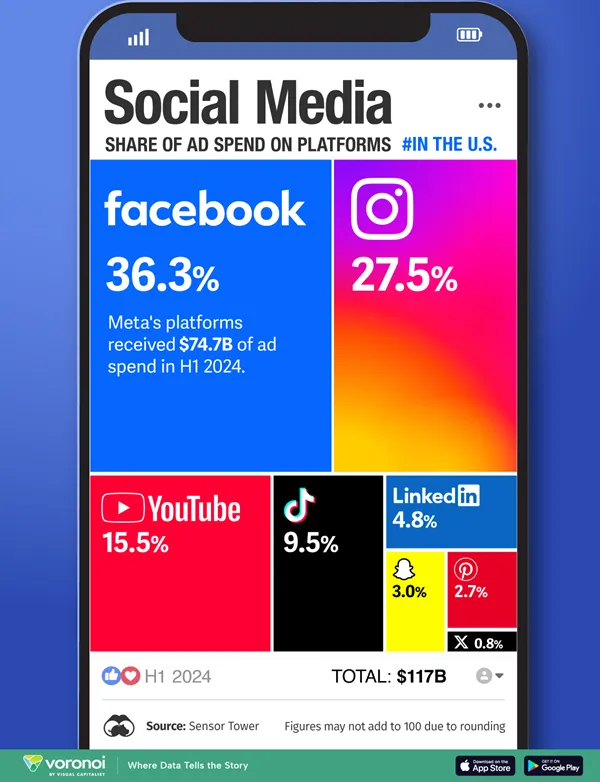
We all know that Meta is he grand champion of the social media revenue stakes, but just how dominant is Zuck’s social behemoth when it comes to ad intake, and how other platforms stack up?
That’s the focus of this visualization from Visual Capitalist, which compares the social media ad spend among the major players.
The data is based on social ad spending in the first half of 2024, using data sourced from app intelligence provider Sensor Tower. So there may be variances in the current time period, and each app also has other sources of revenue. But advertising is where they make most of their money, which makes this an indicative overview of where they’re currently placed.
An interesting look at the state of play. You can read more in Sensor Tower’s “State of Digital Advertising Report” here.

How Real-Time Data Unlocks 100X AI Performance
Are you still manually copying data into your AI tools every time you need an analysis? Do you keep uploading...

Ad Creative Strategy: The Easy Way to Improve Facebook and Instagram ROAS
Are your Facebook and Instagram ads getting lost in the feed while your competitors keep stealing the clicks? Are you...

Social platforms call on EU regulators to ensure the continuity of child protection measures
A joint statement from Google, LinkedIn, Snapchat, Meta, Microsoft and TikTok asked lawmakers to create a better framework or extend...

How to Use TikTok’s Verified Business Account Features and Local Feed
Are you struggling to reach local customers on TikTok? Wondering whether switching to a business account is worth the effort?...