


In some ways, this is an absurd thing to put into a chart like this, as the imbalance is so significant that it seems unnecessary.
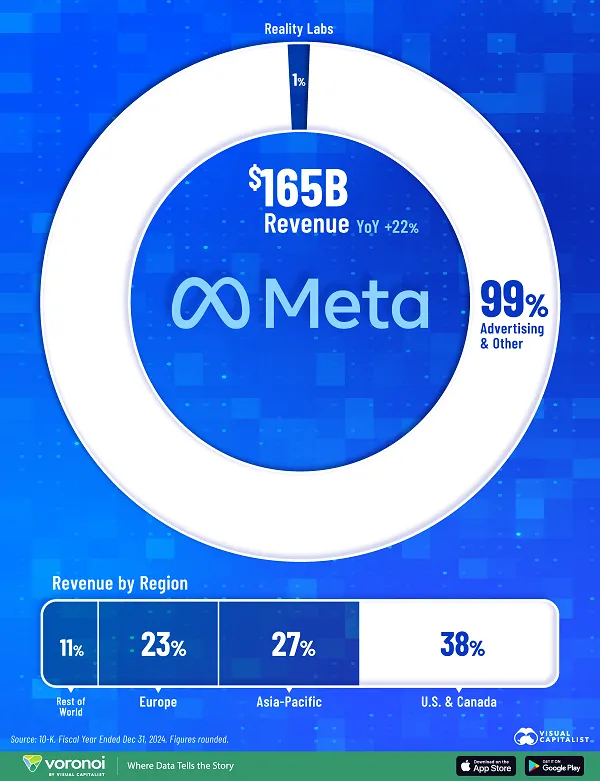
But the below chart from Visual Capitalist, which highlights just how much money Meta makes from ads, does underline the significance of its ad business, in variance to its other offerings, like its Quest VR headsets, Ray Ban Meta glasses, subscriptions, data licensing, etc.
For all of its various projects, Meta still makes almost all of its money from ads served across its apps.
Which, at more than 3 billion active users across Facebook, IG, Messenger, Threads, and WhatsApp, makes sense. But, yeah, if you were thinking that its hardware sales might be catching up, or its verification subscriptions might be a big thing, they’re nothing compared to its overall ad intake.
As you can also see, North America remains its key revenue market, by a big stretch.
A handy, quick reference to visualize how significant Zuckerberg’s ad empire is.
Meta acquires humanoid robot developer Assured Robot Intelligence
Listen to the article 4 min This audio is auto-generated. Please let us know if you have feedback. It looks...

New Instagram Tools to Drive Traffic, Optimize Your Content, and Establish Branding : Social Media Examiner
Social Marketing Trends The data you've been missing! Need a new plan? Discover how marketers plan to...

Intro to Claude Cowork: How to Get Started
Looking for a way to get actual work done with AI, not just chat with it? Tired of micromanaging every...

Increasing Conversions: Quick Wins That Work in 2026
Are you putting out more content than ever but seeing conversion rates stall or drop? Is your audience slipping away,...