


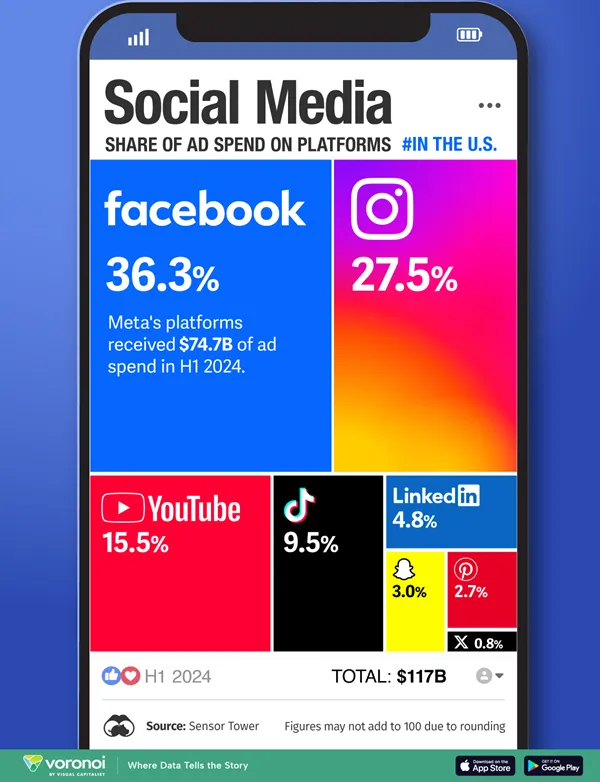
We all know that Meta is he grand champion of the social media revenue stakes, but just how dominant is Zuck’s social behemoth when it comes to ad intake, and how other platforms stack up?
That’s the focus of this visualization from Visual Capitalist, which compares the social media ad spend among the major players.
The data is based on social ad spending in the first half of 2024, using data sourced from app intelligence provider Sensor Tower. So there may be variances in the current time period, and each app also has other sources of revenue. But advertising is where they make most of their money, which makes this an indicative overview of where they’re currently placed.
An interesting look at the state of play. You can read more in Sensor Tower’s “State of Digital Advertising Report” here.

Facebook wants to scan users’ camera rolls for content
Listen to the article 4 min This audio is auto-generated. Please let us know if you have feedback. Facebook is...

Advanced AI Deep Research: Uncover Insights Your Competitors Are Missing
Are you spending days trying to keep up with everything happening in your industry? Wondering how to make faster, better-informed...

Facebook’s 2026 Rules for Reach & Relevance
Are you spending hours creating content on Facebook only to watch your reach plateau or shrink? Wondering how the latest...

X boosts incentives for original content creators
Listen to the article 4 min This audio is auto-generated. Please let us know if you have feedback. X is...